Open-source archive of real-time air quality data from CPCB monitoring stations across India. Data downloaded using vayuayan.
Open-source archive of real-time air quality data from CPCB monitoring stations across India. Data downloaded using vayuayan.
Loading district-level air quality map...
| Rank | District | State | Latest AQI |
|---|
| Rank | District | State | Latest AQI | Category |
|---|
| Rank | Name | Latest AQI | Category |
|---|
| Rank | Name | Latest AQI | Category |
|---|
Read gzipped CSV files directly from GitHub URLs using pandas:
Use readr to load compressed data directly:
Download raw compressed files:
Search and filter station data:
Loading...
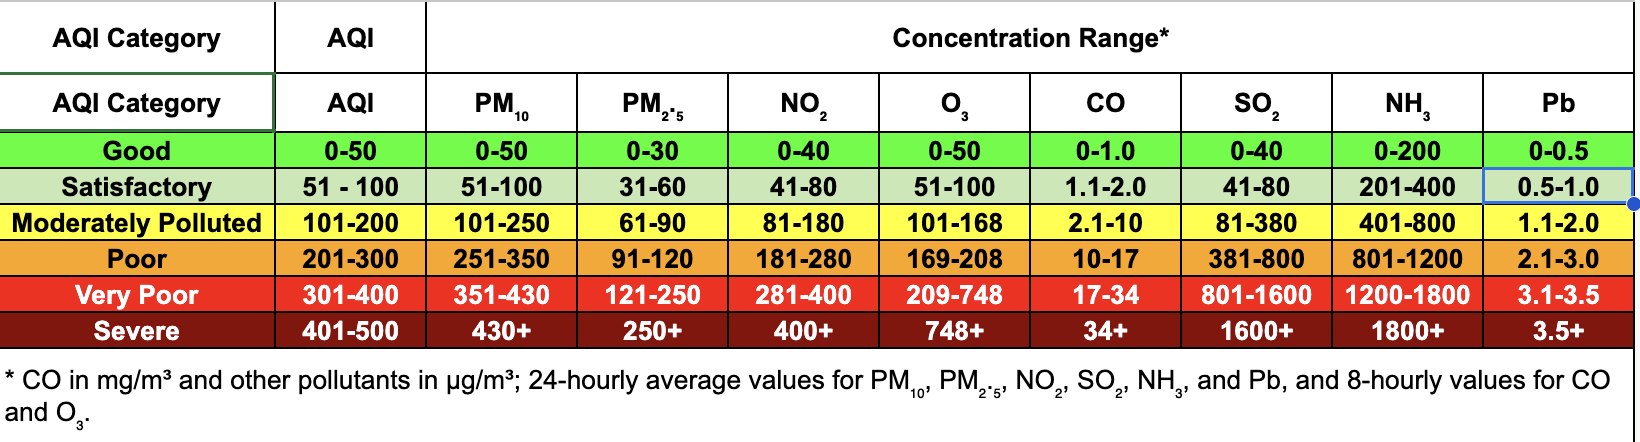
Air Quality Index (AQI) is a number used to convey the quality of air by the government to the general public. Air quality deteriorates with an increase in the concentration of pollutants. The Air Quality Index represents the severity of pollution for ordinary people.
According to the Indian Government (CPCB), Indian AQI range is from 0-500, from 0 being good and 500 being severe. There are eight major pollutants to be taken into account for AQI calculation: particulate matter (PM 10 and PM 2.5), carbon monoxide (CO), ozone (O₃), nitrogen dioxide (NO₂), sulfur dioxide (SO₂), ammonia (NH₃), and lead (Pb).
| AQI Range | Category | Health Impact |
|---|---|---|
| 0-50 | Good | Minimal or no impact on health |
| 51-100 | Satisfactory | Breathing difficulty in sensitive groups |
| 101-200 | Moderate | Breathing discomfort for children and elderly people |
| 201-300 | Poor | Health effects on long-term exposure |
| 301-400 | Very Poor | Respiratory illness on long exposure |
| 401-500 | Severe | Severe health impacts on all |
The formula to calculate AQI is the same as per the Indian CPCB and US-EPA. The AQI is calculated using the equations separately for each parameter. For example, if you wish to calculate AQI on the basis of four parameters, use the equation four times, and the worst sub-index communicates the AQI.
If the current concentration of PM2.5 is 110 µg/m³, then referring to AQI range as per Indian standards:
Putting the values in equation:
Similarly, calculate the sub-index for other parameters, and the worst sub-index represents the overall AQI.
Note: To calculate AQI, a minimum of three parameters should be taken, of which one must be either PM10 or PM2.5. To calculate sub-indices, 16 hours of data is needed.
This website calculates AQI primarily from PM2.5 concentrations using the following CPCB breakpoints:
Each station is scored based on three factors: Consistency (50%) - proportion of days with data within the station's active period; Coverage (30%) - total days of data relative to global date range; Span (20%) - how long the station has been collecting data.
| Rank | Station | City | State | Score | Avg AQI | AQI Rank | Days | First Date | Last Date |
|---|---|---|---|---|---|---|---|---|---|
| Loading... | |||||||||